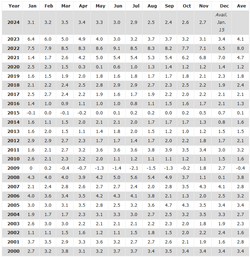
This is a chart of the Consumer Price Index. It represent a "basket" of consumer goods and the overall prices for that "basket" of goods in the US. Perhaps better defined by the BLS:
"a measure of the average change over time in the prices paid by consumers for a representative basket of consumer goods and services"
View attachment 61978
The chart shows a decline in the prices paid for that basket of goods over time, starting in November of 2022, about 2 years ago.
Why is Trump suddenly not so sure he can deliver on getting prices down even more?
Maybe a reasonable person would not expect zero inflation, but it was a hair below zero in 2009, and was darn close to zero in 2015.
Although 2.4% inflation is considered "healthy" (the economy cannot expand without it), it certainly would not be impossible for the decline we have seen for the last two years to continue. It's happened before:
View attachment 61980
Zeroing in more on the groceries side of the CPI:
View attachment 61981
View attachment 61982
The dark line represents an increasing decline in prices of groceries since mid-late 2022.